
An MCAT GPA grid is a comparison tool, not a rule that medical schools use to trade one metric for the other. Schools can consider MCAT scores and GPA together while also reviewing your experiences, attributes and applicant context.
Your place on the grid can provide useful context for evaluating your academic profile, but it cannot determine how an individual school will review your application. The important questions are what the grid measures, which GPA it uses and how its group results apply to your planning.
What the MCAT and GPA Data Shows
- The AAMC grid groups applicants to U.S. MD-granting medical schools by total undergraduate GPA and total MCAT score.
- Each percentage describes the acceptance outcome for a group across three combined application cycles, not your personal probability of acceptance.
- MCAT scores and undergraduate GPAs provide more information about future medical school performance when considered together than either metric provides alone.
- A stronger result in one metric does not create a universal admissions formula that erases a more modest result in the other.
How Medical Schools Compare MCAT Scores and GPA
The AAMC Mission-Aligned Selection framework considers experiences, attributes and academic metrics. It describes individualized review of test scores, grades, experiences and applicant context rather than selection based on one number.
An AAMC MCAT validity summary reports that MCAT scores and undergraduate GPAs together predict medical school and licensure-exam performance better than either metric alone. That finding concerns future academic performance. It does not establish a universal admissions weighting formula or show how a particular school will decide between two applicants.
MCAT and GPA Acceptance Grid
AAMC FACTS Table A-23 covers applicants and acceptees to U.S. MD-granting medical schools for the 2023-2024 through 2025-2026 application cycles, aggregated. The AAMC defines an applicant as someone who applied to at least one U.S. MD-granting medical school through AMCAS or TMDSAS. An acceptee is an applicant who received at least one offer of admission from a U.S. MD-granting medical school. The frequencies combine three years of results. A dashed cell represents fewer than 10 applicants, a blank cell represents no applicants and the 2025-2026 MCAT data includes scores through August.
| Total GPA | Less than 486 | 486-489 | 490-493 | 494-497 | 498-501 | 502-505 | 506-509 | 510-513 | 514-517 | Greater than 517 | All MCAT scores |
|---|---|---|---|---|---|---|---|---|---|---|---|
| Greater than 3.79 | 2.8% 9 of 320 | 3.4% 15 of 439 | 8.0% 79 of 990 | 18.5% 416 of 2,247 | 30.6% 1,264 of 4,125 | 44.9% 3,333 of 7,428 | 57.1% 6,173 of 10,817 | 70.5% 9,798 of 13,906 | 77.2% 10,355 of 13,406 | 83.3% 11,773 of 14,138 | 63.7% 43,215 of 67,816 |
| 3.60-3.79 | 1.6% 11 of 687 | 2.8% 24 of 860 | 4.4% 65 of 1,470 | 11.8% 322 of 2,733 | 22.3% 946 of 4,250 | 34.7% 2,037 of 5,873 | 45.4% 3,212 of 7,069 | 60.0% 4,167 of 6,940 | 66.7% 3,165 of 4,744 | 71.3% 1,842 of 2,582 | 42.4% 15,791 of 37,208 |
| 3.40-3.59 | 0.5% 5 of 987 | 0.8% 7 of 901 | 4.4% 67 of 1,535 | 9.7% 226 of 2,325 | 20.0% 628 of 3,146 | 30.3% 1,147 of 3,780 | 36.7% 1,450 of 3,947 | 48.7% 1,510 of 3,100 | 56.5% 1,046 of 1,851 | 66.4% 574 of 865 | 29.7% 6,660 of 22,437 |
| 3.20-3.39 | 0.3% 3 of 1,120 | 1.7% 14 of 844 | 2.8% 33 of 1,198 | 7.8% 119 of 1,534 | 17.5% 356 of 2,037 | 24.7% 514 of 2,084 | 31.8% 557 of 1,752 | 42.3% 569 of 1,344 | 45.5% 316 of 694 | 60.7% 215 of 354 | 20.8% 2,696 of 12,961 |
| 3.00-3.19 | 0.4% 4 of 949 | 1.7% 12 of 708 | 2.3% 19 of 814 | 6.5% 64 of 989 | 15.4% 173 of 1,122 | 23.2% 251 of 1,084 | 28.4% 245 of 863 | 37.4% 243 of 649 | 43.3% 138 of 319 | 46.5% 60 of 129 | 15.9% 1,209 of 7,626 |
| 2.80-2.99 | 0.3% 2 of 776 | 1.3% 6 of 470 | 1.6% 8 of 488 | 5.6% 29 of 517 | 10.8% 59 of 544 | 23.3% 110 of 473 | 27.7% 97 of 350 | 39.0% 89 of 228 | 36.4% 39 of 107 | 41.7% 20 of 48 | 11.5% 459 of 4,001 |
| 2.60-2.79 | 0.2% 1 of 504 | 1.7% 4 of 241 | 1.9% 5 of 262 | 4.5% 11 of 246 | 10.4% 25 of 241 | 17.9% 40 of 223 | 22.1% 36 of 163 | 33.8% 27 of 80 | 32.0% 16 of 50 | 35.7% 5 of 14 | 8.4% 170 of 2,024 |
| 2.40-2.59 | 0.5% 2 of 368 | 0.0% 0 of 151 | 1.8% 2 of 113 | 1.6% 2 of 126 | 12.5% 11 of 88 | 17.9% 12 of 67 | 21.4% 12 of 56 | 37.5% 12 of 32 | 53.8% 7 of 13 | Fewer than 10 applicants | 6.1% 62 of 1,022 |
| 2.20-2.39 | 0.0% 0 of 235 | 3.4% 3 of 88 | 1.6% 1 of 61 | 4.5% 2 of 44 | 3.7% 1 of 27 | 5.3% 2 of 38 | 14.3% 2 of 14 | 9.1% 1 of 11 | Fewer than 10 applicants | Fewer than 10 applicants | 2.6% 14 of 529 |
| 2.00-2.19 | 0.0% 0 of 117 | 0.0% 0 of 25 | 0.0% 0 of 19 | 5.0% 1 of 20 | 11.8% 2 of 17 | 21.4% 3 of 14 | Fewer than 10 applicants | Fewer than 10 applicants | Fewer than 10 applicants | No applicants | 4.8% 11 of 228 |
| Less than 2.00 | 0.0% 0 of 53 | Fewer than 10 applicants | Fewer than 10 applicants | Fewer than 10 applicants | Fewer than 10 applicants | Fewer than 10 applicants | Fewer than 10 applicants | No applicants | Fewer than 10 applicants | No applicants | 2.3% 2 of 88 |
| All GPAs | 0.6% 37 of 6,116 | 1.8% 85 of 4,736 | 4.0% 279 of 6,959 | 11.1% 1,192 of 10,787 | 22.2% 3,466 of 15,600 | 35.4% 7,449 of 21,066 | 47.1% 11,786 of 25,042 | 62.4% 16,416 of 26,292 | 71.2% 15,087 of 21,199 | 79.9% 14,492 of 18,143 | 45.1% 70,289 of 155,940 |
How to Read the MCAT GPA Grid
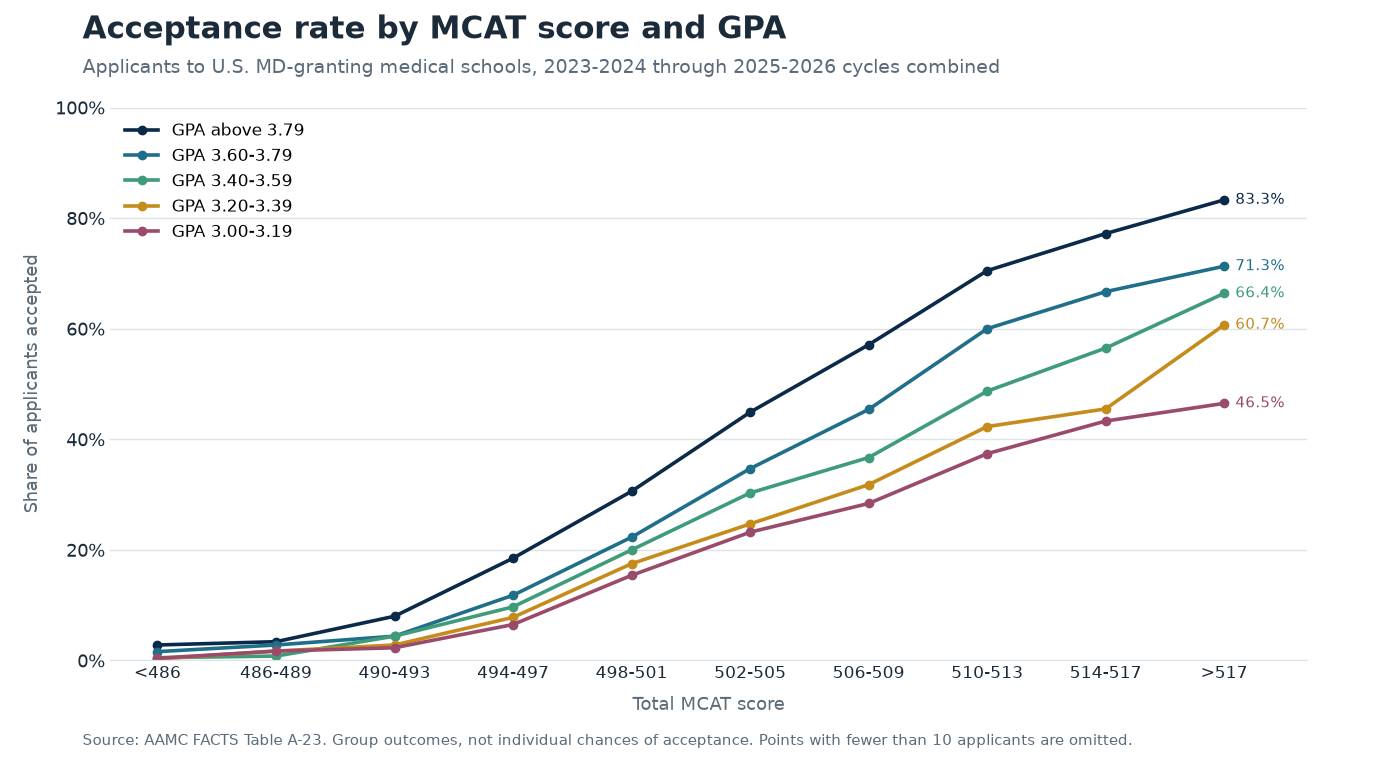
Start at the row for your total GPA range and move to the column for your total MCAT score range. Each cell gives the share of applicants in that combined group who were accepted, along with the numbers of acceptees and applicants used to calculate the percentage.
For example, the table above reports that applicants with a total GPA from 3.60 to 3.79 and a total MCAT score from 506 to 509 had a 45.4% acceptance rate. That cell contains 3,212 acceptees among 7,069 applicants. Across all GPA and MCAT groups in the table, 70,289 of 155,940 applicants were accepted, an overall rate of 45.1%.
At the upper end of both ranges, applicants with a total GPA above 3.79 and a total MCAT score above 517 had an 83.3% acceptance rate, with 11,773 acceptees among 14,138 applicants. These figures describe outcomes for groups across the combined cycles. They do not account for every part of an individual application and should not be read as a personal prediction.
Can a High MCAT Score Offset a Lower GPA?
A high MCAT score does not automatically offset a lower GPA in admissions. The table above shows that applicants with a total GPA from 3.20 to 3.39 and a total MCAT score from 514 to 517 had a 45.5% acceptance rate, with 316 acceptees among 694 applicants. It also shows that applicants with a total GPA above 3.79 and a total MCAT score from 494 to 497 had an 18.5% acceptance rate, with 416 acceptees among 2,247 applicants.
The AAMC MCAT Validity Data Report from July 2024 found that higher undergraduate GPAs could compensate for more modest MCAT scores, and higher MCAT scores could sometimes compensate for more modest GPAs, when predicting future performance in medical school. The report also says that reviewing transcripts, experiences and other application information adds insight when the metrics differ. This finding is about performance prediction, not an admissions rule. No universal compensation formula follows from it.
Which GPA Matters?
AMCAS calculates a separate BCPM GPA and AO GPA in addition to total GPAs. BCPM covers biology, chemistry, physics and math, while AO covers all other coursework. Courses that AMCAS classifies as natural and physical sciences are not included in the BCPM GPA. IMA’s guide to how AMCAS calculates GPA and classifies courses provides more detail about these categories.
Postbaccalaureate coursework is included in the undergraduate total GPA and is also reported as a separate postbaccalaureate GPA. When relevant, AMCAS also provides schools with a graduate GPA in addition to the BCPM, non-BCPM and total undergraduate GPAs. You can use IMA’s medical school GPA calculator to organize your GPA information before comparing it with the grid.
What to Do With Your Results
Compare the Grid With School Benchmarks
Use your grid cell as national context, then review average GPA and MCAT scores by medical school. Do not treat the national group percentage as a promise that an individual school will reach the same decision.
Check Your GPA and MCAT Information
Confirm that you are comparing the table with your total undergraduate GPA rather than substituting your BCPM, AO, postbaccalaureate or graduate GPA. If you are estimating or converting an exam result, use IMA’s MCAT score calculator before locating the appropriate score range.
Plan Preparation and Retake Decisions
If you are considering an MCAT retake, identify what you would change in your preparation and what result you would need for the retake to affect your plans. A grid cell can help frame that decision, but it cannot decide whether another attempt is right for you.
Frequently Asked Questions
Is MCAT or GPA More Important?
Neither metric has a universal level of importance across all medical school decisions. The AAMC reports that MCAT scores and undergraduate GPAs together predict medical school and licensure-exam performance better than either one alone, while its selection framework also considers experiences, attributes and applicant context.
Can a High MCAT Offset a Low GPA?
A high MCAT can accompany a lower GPA in an accepted applicant group, but it does not automatically offset that GPA. AAMC research found that the two metrics could sometimes compensate for each other when predicting future medical school performance, not when determining an admissions decision.
Which GPA Does the MCAT GPA Grid Use?
The AAMC MCAT GPA grid uses total undergraduate GPA. AMCAS also reports BCPM, AO, postbaccalaureate and, when relevant, graduate GPA information, but those separate GPA categories are not the GPA bands displayed in Table A-23.
Is There an MCAT and GPA Grid for DO Schools?
The AAMC grid does not cover DO schools. It covers applicants and acceptees to U.S. MD-granting medical schools. AACOM publishes separate applicant and matriculant average MCAT data for osteopathic medical schools, but that source does not establish a matching acceptance-rate grid.
Does a Grid Percentage Predict My Chance of Acceptance?
No. A grid percentage reports the acceptance outcome for applicants within a GPA and MCAT group across the combined cycles. It is not an individual probability and does not represent how a particular medical school will evaluate the rest of your application.